Twitter Ads?
Twitter has updated their ads dashboard to include a few new tools. Not only can you see statistics on your Twitter ads, you can also see organic tweet analytics. In the dashboard, you can see each tweet you have made, the number of impressions it had, retweets as well as favorites. This will be listed out as impressions, engagements, and engagement rates.
Each tweet can be opened and will have a list of statistics. On the right hand side of your tweet feed, all the Engagements will be shown with a graph and timeline.
Twitter defines the new dashboard as allowing you to:
With the new dashboard, you can:
- See how your Tweets are performing in real time.
- Compare impressions (times a Tweet is viewed by anyone on Twitter web and Android or iOS apps, including logged-out users), total engagements and Retweets month over month.
- Use the Tweet details page to see how many Retweets, replies, favorites, follows, link clicks and embedded media clicks each Tweet received.
- Export your Tweet performance metrics into a CSV file, which now includes both organic and promoted data.
The advantage of this will help you determine what times and days are the best to send out tweets. Within the dashboard, you will be able to browse by date and tag to better inform yourself of all the analytics you may need. 

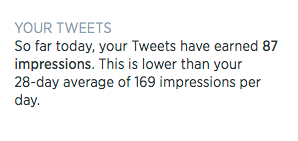
Twitter also provides you with an update on your tweets and the amount of impressions you are getting on a daily basis compared to your previous tweets. Pretty cool huh? 
Do you use Twitter ads? How successful do you think they have been? Do you like the new tools that have been added to the dashboard?
Read Twitter's entire blog post about the Dashboard Updates here!
Comments